Testing in Practice · Part 13
Test estimation (hands-on): three-point estimates, a 100,000-run simulation, and why adding up 'most likely' fails
ProvaLab team · · 12 min read
"How long will testing take?" is one of the first questions a tester is asked about a new feature, and one of the hardest. Answer too high and you're told testing is slow. Answer too low and you'll be working weekends, or releasing with half the tests not run.
Most test estimates are wrong in the same direction: too low. Not because testers are bad at it, but because of how the numbers are put together. This post estimates the testing for a new FoodNow feature step by step, and uses a short Python script to show where the usual method goes wrong and what to say instead.
The task estimates below are an example of what a test team might give for this feature. They're judgement, as all estimates are. Every number calculated from them, including the 100,000-run simulation, comes from running the scripts in this post.
Why test estimates go wrong
- Adding up the "most likely" times. Each task's most likely time is more likely than any other single value, but tasks overrun more than they underrun. Add nine of them up, and the total is very unlikely. Step 3 measures how unlikely.
- Forgetting the loop. Testing isn't one pass. You find bugs, they're fixed, you retest, and you run the regression tests again. Teams estimate the first pass and forget the rest.
- Testing waits on other work. A late build, a broken test environment or missing test data stops testing, and the clock keeps running.
- Turning hours into days too simply. Nobody tests for eight hours a day. Meetings, questions, and context switching take their share.
The techniques, briefly
| Technique | How it works | Good for |
|---|---|---|
| Work breakdown | List every testing task, estimate each one | Always. It's the base for the others. |
| Three-point (PERT) | Optimistic, most likely and pessimistic time per task | Showing uncertainty, not hiding it |
| Historical data | How long similar work took, and how far off past estimates were | Correcting your team's own bias |
| Planning poker / Wideband Delphi | Several people estimate separately, then discuss the differences | Finding tasks someone misunderstood |
| Ratio of development effort | "Testing is about 30–40% of development" | A sanity check, never the estimate |
This post uses the first three together.
Step 1: Break the work down
The feature is group ordering: an office manager starts a group order, colleagues add their own dishes from a link, and the manager pays once. Here are the testing tasks, each with three estimates in hours:
- O (optimistic): if everything goes well.
- M (most likely): what usually happens.
- P (pessimistic): if things go badly, but not a disaster.
Save them as tasks.csv:
task,optimistic,likely,pessimistic
Read the stories and ask questions,3,4,8
Write test cases (about 40),10,14,24
Set up test data: offices and 30 test users,3,5,12
Automate the 10 most important cases,12,16,30
First run of all cases,8,10,16
Report bugs and talk them through,3,5,12
Retest fixes and run regression,6,10,28
Exploratory testing (3 sessions),5,6,9
Test summary report,2,3,5
Look at "Retest fixes and run regression": 6 hours if the build is clean, 28 if it isn't. That one line is where most test estimates go wrong, and here it has its own row with an honest range.
Break tasks down until each one is small enough to picture doing, roughly a day or less. "Test group ordering: 70 hours" can't be checked. "Write about 40 test cases: 14 hours" can: that's about 20 minutes a case.
Step 2: Three-point estimates
The PERT formula turns three points into one expected value, with the most likely time counting four times:
expected = (O + 4M + P) / 6
Save this as estimate.py:
"""Three-point (PERT) estimate for a test effort, plus a simulation of the total."""
import csv
import random
import statistics
import sys

rows = list(csv.DictReader(open(sys.argv[1], encoding="utf-8")))
tasks = [(r["task"], float(r["optimistic"]), float(r["likely"]), float(r["pessimistic"])) for r in rows]

print(f"{'task':<42}{'O':>5}{'M':>5}{'P':>5}{'PERT':>7}")
for name, o, m, p in tasks:
    print(f"{name:<42}{o:>5.0f}{m:>5.0f}{p:>5.0f}{(o + 4 * m + p) / 6:>7.1f}")

sum_likely = sum(m for _, _, m, _ in tasks)
sum_pert = sum((o + 4 * m + p) / 6 for _, o, m, p in tasks)
print(f"\nsum of 'most likely':      {sum_likely:6.1f} hours")
print(f"sum of PERT expected:      {sum_pert:6.1f} hours")


def pert_sample(o: float, m: float, p: float) -> float:
    """One draw from the PERT (beta) distribution with these three points."""
    if p == o:
        return m
    a = 1 + 4 * (m - o) / (p - o)
    b = 1 + 4 * (p - m) / (p - o)
    return o + random.betavariate(a, b) * (p - o)


random.seed(13)
RUNS = 100_000
totals = sorted(sum(pert_sample(o, m, p) for _, o, m, p in tasks) for _ in range(RUNS))


def pct(q: float) -> float:
    return totals[int(q * RUNS) - 1]


print(f"\nsimulated {RUNS:,} projects:")
for q in (0.5, 0.8, 0.95):
    print(f"  {int(q * 100)}% chance of finishing within {pct(q):6.1f} hours")
within = sum(t <= sum_likely for t in totals) / RUNS
print(f"  chance of finishing within the sum of 'most likely' ({sum_likely:.0f} h): {within:.1%}")
print(f"  mean {statistics.mean(totals):.1f} h, standard deviation {statistics.stdev(totals):.1f} h")
if len(sys.argv) > 2:
    deadline = float(sys.argv[2])
    print(f"  chance of finishing within {deadline:.0f} hours: {sum(t <= deadline for t in totals) / RUNS:.1%}")
It needs only Python, no packages. The first part:
$ python estimate.py tasks.csv
task                                          O    M    P   PERT
Read the stories and ask questions            3    4    8    4.5
Write test cases (about 40)                  10   14   24   15.0
Set up test data: offices and 30 test users    3    5   12    5.8
Automate the 10 most important cases         12   16   30   17.7
First run of all cases                        8   10   16   10.7
Report bugs and talk them through             3    5   12    5.8
Retest fixes and run regression               6   10   28   12.3
Exploratory testing (3 sessions)              5    6    9    6.3
Test summary report                           2    3    5    3.2

sum of 'most likely':        73.0 hours
sum of PERT expected:        81.3 hours
Every PERT value is higher than the most likely value, because every task can overrun by more than it can underrun. Retesting can take 18 hours longer than likely, but only 4 hours less. Added up, the gap is 8.3 hours, more than a full working day.
Step 3: Simulate it 100,000 times
A single number hides the question that matters: how likely is it that we finish within X? To answer it, the script plays out the project 100,000 times. In each run, every task takes a random time drawn from its own three-point range, with times near the most likely value more common. Then it looks at how the totals spread out:
simulated 100,000 projects:
  50% chance of finishing within   81.0 hours
  80% chance of finishing within   86.6 hours
  95% chance of finishing within   92.1 hours
  chance of finishing within the sum of 'most likely' (73 h): 8.7%
  mean 81.3 h, standard deviation 6.3 h
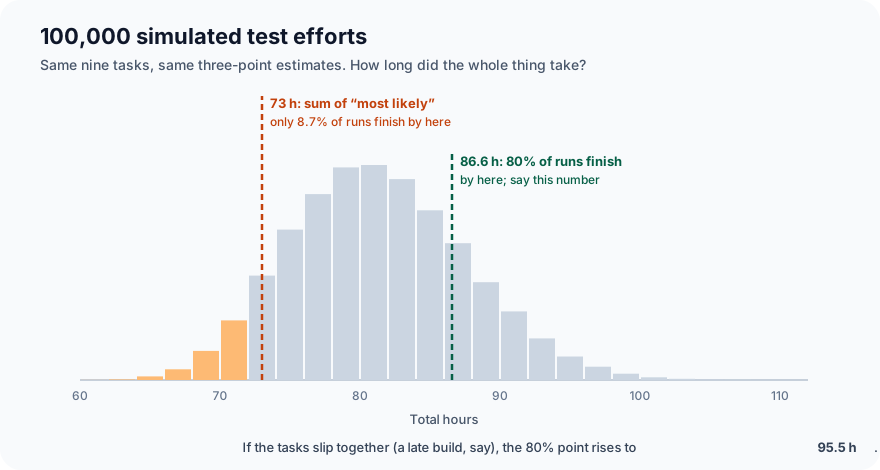
The usual estimate, the sum of the most likely times, is 73 hours. In the simulation, the project finished within 73 hours 8.7% of the time. That's roughly one feature in eleven. The number most teams give is a number they'll almost always miss, even when every single task estimate was reasonable.
The number to give is the 80% point: 86.6 hours. It's not padding. It's the same estimates, added up correctly.
Step 4: When tasks slip together
The simulation above assumes each task goes well or badly on its own. In reality, many causes hit several tasks at once. A late, buggy build makes the first run slower, the bug reports longer and the retesting longer, all together. This script looks at the other extreme, where every task goes equally well or badly. Save it as together.py, with pert_sample copied into estimate_lib.py:
"""If every task goes well or badly together (one shared cause, like a late build),
the total's percentiles are the sums of each task's percentiles."""
import csv
import random
import sys

from estimate_lib import pert_sample

rows = list(csv.DictReader(open(sys.argv[1], encoding="utf-8")))
tasks = [(float(r["optimistic"]), float(r["likely"]), float(r["pessimistic"])) for r in rows]
random.seed(13)
RUNS = 100_000
per_task = [sorted(pert_sample(o, m, p) for _ in range(RUNS)) for o, m, p in tasks]
for q in (0.5, 0.8, 0.95):
    print(f"  {int(q * 100)}%: {sum(s[int(q * RUNS) - 1] for s in per_task):6.1f} hours")
tasks independent:
  50% chance of finishing within   81.0 hours
  80% chance of finishing within   86.6 hours
  95% chance of finishing within   92.1 hours
tasks move together:
  50%:   79.3 hours
  80%:   95.5 hours
  95%:  111.0 hours
The middle barely moves, but the 80% point rises from 86.6 to 95.5 hours, and the 95% point from 92 to 111. Real projects sit somewhere between these two cases. So when you give the 80% number, also say what would push it up: "86 hours, or up to 95 if the build arrives late or unstable."
Step 5: Check against your own history
The best correction for your estimates is your own past. If your team tracks estimated and actual testing time per feature, compare them. The history below is an example, written for this post. Use your own. Save it as history.csv:
feature,estimated_hours,actual_hours
Saved addresses,40,52
Promo codes,56,61
Order tracking map,72,104
Rate your rider,24,27
Split the bill,64,90
Order for later,48,58
And calibrate.py:
"""How far off were past test estimates? Use it to adjust the next one."""
import csv
import statistics
import sys

rows = list(csv.DictReader(open(sys.argv[1], encoding="utf-8")))
ratios = []
for r in rows:
    ratio = float(r["actual_hours"]) / float(r["estimated_hours"])
    ratios.append(ratio)
    print(f"{r['feature']:<22}{r['estimated_hours']:>6} est {r['actual_hours']:>6} actual   x{ratio:.2f}")
print(f"\nmedian actual/estimate: x{statistics.median(ratios):.2f}  (range x{min(ratios):.2f} to x{max(ratios):.2f})")
if len(sys.argv) > 2:
    est = float(sys.argv[2])
    print(f"a new estimate of {est:.0f} h, adjusted: {est * statistics.median(ratios):.0f} h "
          f"(range {est * min(ratios):.0f} to {est * max(ratios):.0f} h)")
$ python calibrate.py history.csv 73
Saved addresses           40 est     52 actual   x1.30
Promo codes               56 est     61 actual   x1.09
Order tracking map        72 est    104 actual   x1.44
Rate your rider           24 est     27 actual   x1.12
Split the bill            64 est     90 actual   x1.41
Order for later           48 est     58 actual   x1.21

median actual/estimate: x1.25  (range x1.09 to x1.44)
a new estimate of 73 h, adjusted: 92 h (range 80 to 105 h)
In this example, the team's past estimates were all too low, by 9% to 44%. Applied to the sum of most likely times, 73 hours becomes about 92. That's close to the simulation's 80% and 95% points, which is what you'd expect if the past estimates were also sums of most likely times. Two different methods pointing to the same range is a good sign. If they disagree badly, find out why before you give a number.
The biggest overruns in the example are the features with the most integration: a map and split payments. That's worth knowing for the next estimate too.
Step 6: "Can you do it in two weeks?"
The release plan has 10 working days for testing. At about 6 focused testing hours a day, that's 60 hours:
$ python estimate.py tasks.csv 60
...
  chance of finishing within 60 hours: 0.0%
None of the 100,000 simulated projects finished in 60 hours. So the honest answer to "can you do it in two weeks?" is no, not with this scope.
The usual next move is to cut scope. Say we automate only the 4 riskiest cases instead of 10, and run one exploratory session instead of three:
-Automate the 10 most important cases,12,16,30
+Automate the 4 riskiest cases,5,7,13
-Exploratory testing (3 sessions),5,6,9
+Exploratory testing (1 session),2,2,3
$ python estimate.py tasks-cut.csv 60
...
sum of PERT expected:        67.2 hours

simulated 100,000 projects:
  50% chance of finishing within   66.8 hours
  80% chance of finishing within   71.8 hours
  95% chance of finishing within   76.8 hours
  chance of finishing within the sum of 'most likely' (60 h): 9.3%
  mean 67.1 h, standard deviation 5.5 h
  chance of finishing within 60 hours: 9.3%
Look at that carefully. After the cut, the most likely times add up to exactly 60 hours. On a spreadsheet, the plan now fits. In the simulation, it fits 9.3% of the time. This is how most unrealistic test plans are made: cut until the most likely numbers add up to the deadline, and call it agreed.
What you can honestly offer instead:
- Time: "With the reduced scope, 72 hours, about 12 days, gets us to 80% confidence."
- More scope cut: say which further tests you'd drop, and what risk that leaves untested. That's a business decision, so let the business make it.
- Fewer unknowns: the widest range is in retesting. An earlier, more stable build narrows it more than any amount of overtime.
- More people: helps the tasks that can be split, like running test cases, but not reading the stories or the final report. Two people don't make it twice as fast.
How to say the number
An estimate is a forecast, so say it like one:
"Testing group ordering: about 87 hours, 15 working days, at 80% confidence. Up to 95 if the build is late or unstable. That includes two rounds of retesting. With 4 automated cases instead of 10 and one exploratory session, it's 72 hours, 12 days."
- A range or a confidence, not a single date.
- The assumptions: what's included, what the build needs to be like.
- The options if it's too long, with what each one costs.
Then re-estimate as you learn. After the first test run, you know how buggy the build is, and the retest range narrows. Tell people when your number changes, and why. An updated estimate is information, not failure.
Common mistakes
- Adding up the most likely times. In our example, that total was met 8.7% of the time.
- One line for "testing". Break it down, so each task can be checked and nothing is forgotten.
- No line for retesting and regression. It's often the biggest and most uncertain task.
- Eight-hour days. Use the hours you actually spend testing, usually 5 to 6.
- Cutting scope until the most likely times fit the deadline. That gave a 9.3% plan. Check the chance, not the sum.
- Never comparing estimates with actuals. Without history, the same mistake repeats on every feature.
- Treating the estimate as a promise. Re-estimate after the first test run, when you know much more.
What's next
In Part 14 of Testing in Practice we look at the test summary report and test metrics: what to put in the report at the end of testing, which numbers help people decide, and which ones only look good.
ProvaLab's test management system records how long every test result took to run and when each test run started and finished, so the history behind Step 5 builds up as you test instead of being reconstructed from memory. Test plans keep the scope and the dates together, so when scope is cut, the plan shows what was dropped. See it in the two-minute product tour.
See ProvaLab working on a real app
Your coding agent runs the tests, reads the failures and fixes them.